
This is Lesson 1 of 8 from AI For Youth: Grade 10, shown exactly as subscribers see it. No account is needed to read it. Subscribers get every lesson, the graded quizzes, the project, progress tracking, and a certificate of completion.
Get accessYour child already lives in a world full of AI, and that will be true for the rest of their life. The good news is that understanding it is well within reach. This course explains how AI really works at your child’s grade level, one clear lesson at a time, so they can use it with confidence and know when to double-check it. The first lesson is below. Read it together and see if it fits.
This lesson introduces the decision tree, a model made of yes-or-no questions about the features. It covers how a tree is run by hand, how the training algorithm chooses each question, why a tree that is allowed to grow without limit memorizes its training data, and what shape of boundary a tree can and cannot draw. The nearest neighbor model from Grade 9 could make a prediction but could not give a reason for it; a decision tree is a model that consists of nothing but reasons.
By the end of this lesson you can
- Run a decision tree by hand and explain any prediction it makes.
- Choose the best first question by comparing how cleanly each split separates the labels.
- Explain why a deep tree overfits, and what limiting its depth does.
- Say what trees are good at, and what shape of boundary they cannot draw.
The decision tree
A decision tree is a model made of a sequence of yes-or-no questions about the features. Each answer leads either to another question or to a prediction. To make a prediction, start at the first question and follow the answers until a prediction is reached.
The nearest neighbor model from Grade 9 predicts by finding the stored example most similar to the new one and copying its label. Asked why it predicted a pass, the only answer it can give is that the new student resembles some other student. That is a true answer, but it does not tell a student what to change. A decision tree gives a different kind of answer: the list of questions and answers that led to the prediction.
Figure 1 shows a complete decision tree. It was trained on ten students, using the same two features that Grade 9 used: hours studied per week and attendance.
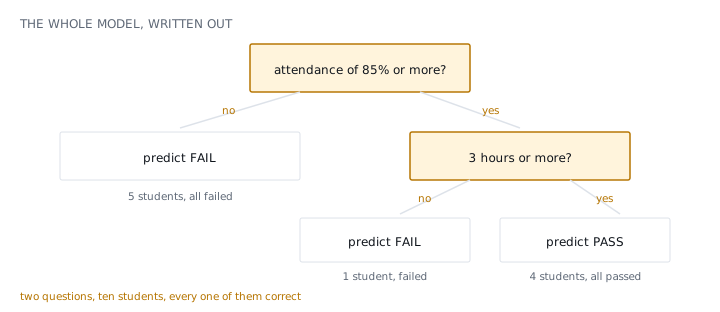
Worked example. A new student has 86% attendance and 7 hours of study per week. The tree is run as follows.
- First question: is attendance 85% or more? 86% is, so the answer is yes. Go right.
- Second question: is study time 3 hours or more? 7 hours is, so the answer is yes. Go right.
- The right-hand branch ends in a prediction: pass.
The whole model was executed in two steps, and the reasoning can be stated in one sentence: attendance is at least 85% and study time is at least 3 hours, so the tree predicts a pass.
A model is interpretable when a person can inspect it and understand why it produces the answers it does. Decision trees are among the few models that are genuinely interpretable, not merely small.
Try it
- Run the tree in Figure 1 for a student with 80% attendance and 10 hours of study. What does it predict, and which question decided it?
- Run it for a student with 90% attendance and 2 hours of study.
Answers
1. Fail. Attendance is below 85%, so the first question sends the student left, straight to a prediction. The second question is never asked, so the 10 hours of study make no difference.
2. Fail. Attendance passes the first question (90% is at least 85%), but 2 hours is below the 3-hour threshold at the second question.
How the questions are chosen
Nobody chose the two questions in Figure 1 by hand. The training algorithm found them, and the method is simple: try every feature at every sensible threshold, and keep whichever split separates the labels most cleanly.
A split is one yes-or-no question about one feature at one threshold, such as “attendance ≥ 85”. A split divides the examples that reach it into a yes-side and a no-side.
The ten students the tree was trained on are listed below.
12 95 yes 3 60 no
10 88 yes 1 45 no
8 92 yes 4 65 no
4 88 yes 2 55 no
2 86 no 6 72 no
Four students passed and six failed. A candidate split is scored by one measure: the number of students that would be classified correctly if the tree stopped at that split and predicted the majority label on each side.
Worked example. Two candidate first questions, scored on the ten students.
hours ≥ 5 yes-side: 3 pass, 1 fail no-side: 1 pass, 5 fail 8 of 10
For the attendance split, the yes-side majority is pass (4 of 5 correct) and the no-side majority is fail (5 of 5 correct), for 9 of 10 in total. For the hours split, the yes-side majority is pass (3 of 4 correct) and the no-side majority is fail (5 of 6 correct), for 8 of 10. The attendance split scores higher and is chosen.
A group is pure when every example in it has the same label. A pure group needs no further questions, because predicting its one label gets every example right.
The reason the attendance split is the better choice matters as much as its score. Its no-side is completely pure: five students, all of whom failed, with no exceptions. That is the real target of the algorithm. A split is good when it produces groups that lean as far as possible toward one label.
The algorithm then repeats the same procedure on any group that is still mixed.
- The no-side of the attendance split is pure, so it becomes a prediction: fail.
- The yes-side holds four passes and one failure, so a second question is chosen for those five students only.
- The split hours ≥ 3 separates them perfectly: the four students with 4, 8, 10 and 12 hours passed, and the one student with 2 hours failed.
- Every group is now pure, so the tree is finished. It classifies all ten training students correctly.
Try it
- Score the candidate split attendance ≥ 90 on the ten students. How many does it get right, and is either side pure?
- After the split attendance ≥ 85, which side is pure and which side still needs a question?
Answers
1. The yes-side holds the students at 95 and 92, both passes: 2 pass, 0 fail. The no-side holds the other eight: 2 pass (88 and 88) and 6 fail. Predicting the majority on each side gives 2 + 6 = 8 of 10. The yes-side is pure, but the split scores lower than attendance ≥ 85, which gets 9 of 10.
2. The no-side is pure (5 fail, 0 pass). The yes-side is mixed (4 pass, 1 fail) and needs a second question.
Depth and overfitting
The tree in Figure 1 classifies all ten training students correctly. Grade 9 Lesson 5 established what a perfect training score usually means: the model may have memorized the training data rather than learned a pattern. The tree version of this problem is the most direct one in machine learning.
A tree can always reach 100% on its training data. If any group is still mixed, the algorithm asks another question. If that is allowed to continue, eventually every group holds exactly one student, and every student is classified correctly by the question that isolated them. The result is a lookup table written as a set of questions.
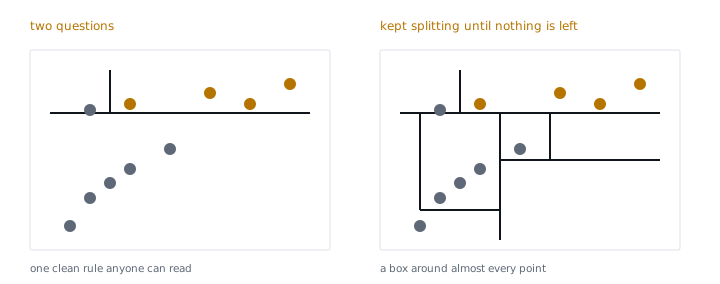
The left panel of Figure 2 is the tree in Figure 1: two cuts, which can be described in a sentence. The right panel is the same algorithm allowed to keep splitting. Each extra box exists to accommodate one student. Those boxes are not patterns; they are individual students, memorized. A new student who lands in one of those boxes gets the label of whichever training student happened to be there.
Maximum depth is the number of questions a tree may ask before it must commit to an answer. Depth 1 is a single question. Depth 2 is the tree in Figure 1. Depth 10 is the right-hand panel of Figure 2.
Maximum depth is the tree’s equivalent of k in nearest neighbor: a setting that controls how closely the model fits its training data. It is chosen the way Grade 9 chose k. Try several values, and keep the one that scores best on data the tree never saw. The choice is never made on the training rows, because training accuracy only ever rises as depth increases.
Any setting that makes training accuracy go up is a setting that can tune a model into uselessness.
Try it
- A tree of depth 10 scores 100% on its training data and 70% on held-out data. A tree of depth 2 scores 90% on training and 88% on held-out data. Which depth should be kept, and why?
- Explain in one sentence why a tree of unlimited depth can always score 100% on its training data.
Answers
1. Depth 2. The depth-10 tree has a gap of 30 points between training and held-out accuracy, which is the sign of memorizing. The depth-2 tree scores better on data it never saw, which is the only score that matters.
2. Whenever a group is mixed it can ask another question, so it can keep splitting until every group holds one student and every student is classified by its own box.
Strengths of trees, and the staircase limitation
Decision trees have three practical strengths.
1. They explain themselves. For any decision where a person is entitled to know the reason, such as a loan, a diagnosis or a place on a course, a model that can be printed out and read is worth a great deal.
2. They do not depend on units or scale. Grade 9 Lesson 3 required every feature to be rescaled to 0–1, because attendance measured on 0–100 drowned out hours measured on 0–20 inside the distance calculation. A tree never compares two different features with each other. It asks whether attendance is above 85, which is a question about attendance alone. Rescaling a feature changes the threshold number but not the students on each side, so rescaling changes nothing about the tree’s predictions.
3. They take categories directly. “Is the subject history?” is already a yes-or-no question. No conversion of the category to a number is needed.
The limitation is visible in Figure 2. Every cut a tree makes is straight across one axis, because every question is about one feature. A tree’s boundaries are therefore always horizontal and vertical lines. The overall shape is a staircase.
A staircase is adequate until the real pattern runs diagonally. Suppose what matters is hours and attendance together, so that the true boundary is a slanted line. A tree can approximate the slant, but only with many small steps, and each step costs a question and uses up training data. The tree is doing with twenty questions what a single tilted line would do with one.
The next model draws the tilted line directly. Lesson 2 builds one, and obtains something a tree does not provide: not just an answer, but a measure of how confident the model is in it.
Try it
- The hours column is rescaled by dividing every value by 20, so that 12 hours becomes 0.6. What happens to the second question in Figure 1, and what happens to the tree’s predictions?
- The true rule in a dataset is “pass if hours plus attendance divided by 10 is at least 15”. Describe what a tree’s boundary for this rule looks like.
Answers
1. The threshold becomes 0.15 (3 divided by 20). Exactly the same students fall on each side, so every prediction is unchanged.
2. The rule is a slanted line, which a tree cannot draw. It approximates the line with a staircase of horizontal and vertical steps, using many questions where one tilted line would do.
Summary
- A decision tree is a sequence of yes-or-no questions about the features. A prediction is made by following the answers from the first question to a prediction.
- Training chooses each question by trying every feature at every sensible threshold and keeping the split that classifies the most examples correctly. Pure groups, where every example shares one label, need no further questions.
- On the ten-student table, attendance ≥ 85 scores 9 of 10 and hours ≥ 5 scores 8 of 10. The attendance split wins, and its no-side is pure.
- A tree can always reach 100% on its training data by splitting until every group holds one example. Maximum depth limits this, and it is chosen on held-out data, never on training data.
- Trees are interpretable, unaffected by rescaling, and accept categories directly. Their boundaries are staircases, so a diagonal boundary costs many small steps.
Key terms
- Decision tree — a model made of yes-or-no questions about the features, each leading to another question or a prediction.
- Interpretable — a model a person can inspect and understand.
- Split — one question about one feature at one threshold, dividing examples into a yes-side and a no-side.
- Pure — a group in which every example has the same label.
- Maximum depth — the number of questions a tree may ask before it must give an answer.
Check your understanding
5 questions · 70% to pass · retakes encouraged
In the full course the graded quiz comes next and your progress is saved. Get access to continue.
Want the next free lesson by email? We post new free lessons and short tips for guiding your child with AI.
A short note when new free lessons are posted, plus occasional tips. No spam. Unsubscribe any time.That is the whole first lesson. The full AI For Youth: Grade 10 course has 8 lessons, 8 quizzes, and a project. One subscription unlocks every course, kindergarten through grade 12, plus AI Fundamentals for general audiences.
Get access